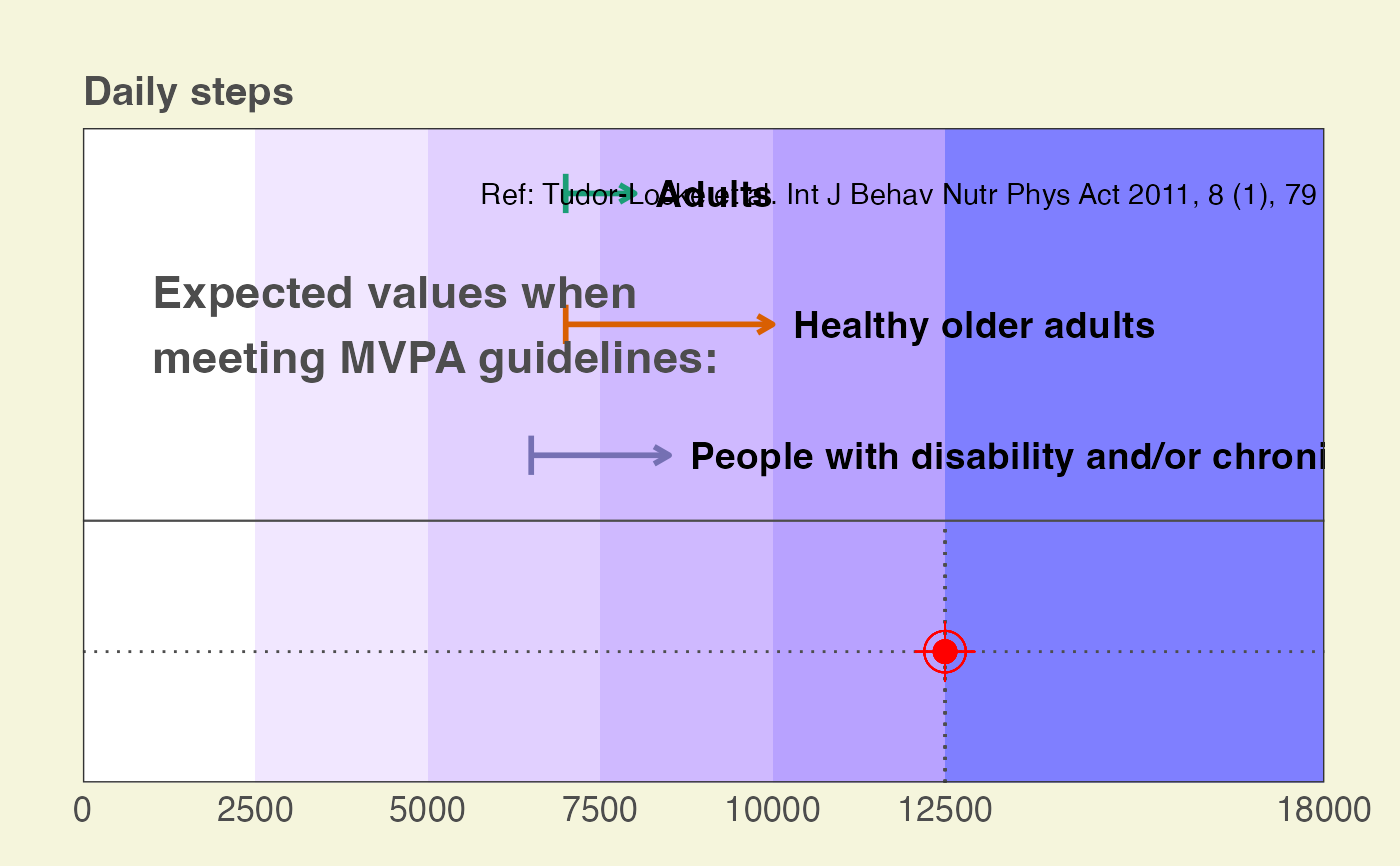
The function generates a figure showing the daily mean of the daily step count in correspondence with the Tudor-Locke et al. (2011; doi: 10.1186/1479-5868-8-79) categories.
Usage
create_fig_steps(score, language = c("en", "fr", "de"))Examples
create_fig_steps(score = 12500)
#> Warning: All aesthetics have length 1, but the data has 6 rows.
#> ℹ Please consider using `annotate()` or provide this layer with data containing
#>   a single row.
#> Warning: All aesthetics have length 1, but the data has 6 rows.
#> ℹ Please consider using `annotate()` or provide this layer with data containing
#>   a single row.
#> Warning: All aesthetics have length 1, but the data has 6 rows.
#> ℹ Please consider using `annotate()` or provide this layer with data containing
#>   a single row.