Create a figure showing the mean daily sedentary (SED) time
Source:R/create_fig_sed.R
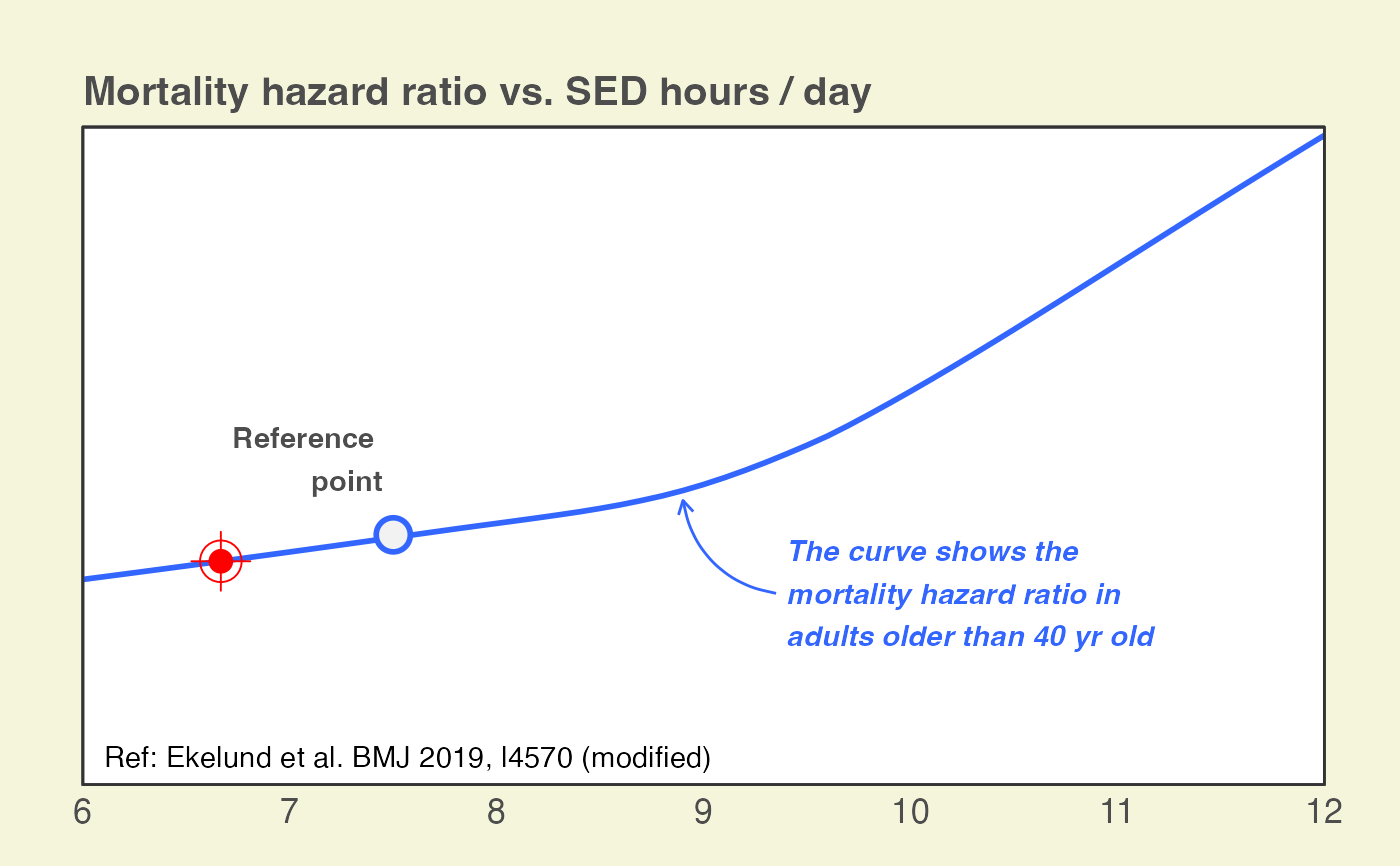
create_fig_sed.RdThe function generates a figure showing mortality hazard ratio in correspondence with daily SED hours. The figure is based on data extracted from Ekelund et al. paper (2019; doi: 10.1136/bmj.l4570).
Usage
create_fig_sed(score, language = c("en", "fr", "de"))