Create a figure showing the mean daily Physical Activity Level (PAL)
Source:R/create_fig_pal.R
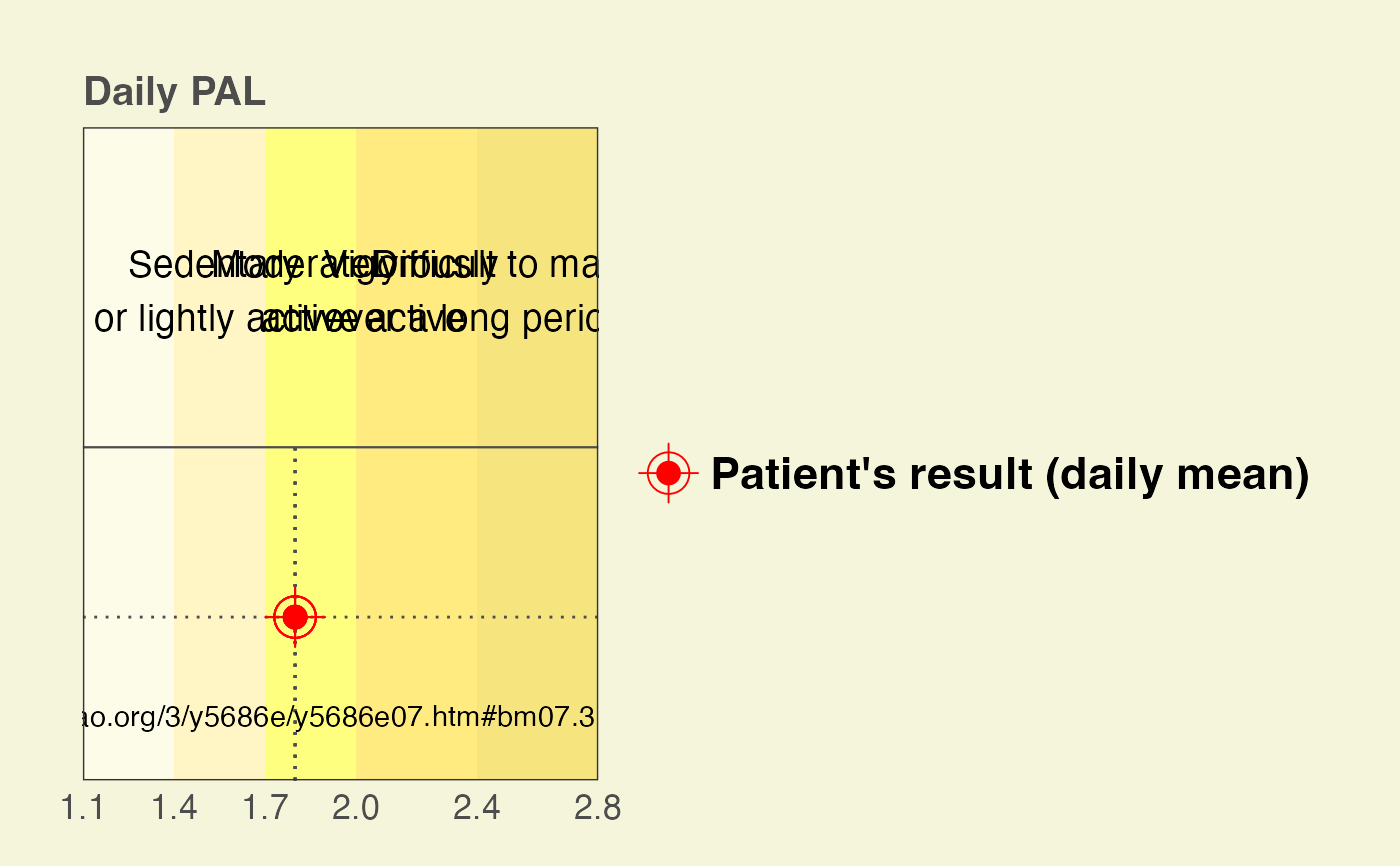
create_fig_pal.RdThe function generates a figure showing the daily mean of PAL in correspondence with the FAO (2004; http://www.fao.org/3/y5686e/y5686e07.htm#bm07.3) categories.
Usage
create_fig_pal(score, language = c("en", "fr", "de"))Examples
create_fig_pal(score = 1.8)
#> Warning: All aesthetics have length 1, but the data has 5 rows.
#> ℹ Please consider using `annotate()` or provide this layer with data containing
#>   a single row.
#> Warning: All aesthetics have length 1, but the data has 5 rows.
#> ℹ Please consider using `annotate()` or provide this layer with data containing
#>   a single row.
#> Warning: All aesthetics have length 1, but the data has 5 rows.
#> ℹ Please consider using `annotate()` or provide this layer with data containing
#>   a single row.